Take a real-world example: a smartphone battery dropping from full to 80% capacity after a few hundred cycles. We’ll analyze how cycle life hinges on depth of discharge, state of charge, and full charge cycles, then compare chemistries, degradation mechanisms, and practical tests. Our goal is to quantify longevity with empirical constraints and outline ways to extend it, but the clues we need to unlock are nuanced and require careful consideration of usage patterns and conditions. Stay with us as we map the landscape.
Key Takeaways
- Cycle life is the number of full charge/discharge cycles until capacity drops to end-of-life (about 80% of original).
- DoD, SoC, and FCC/FCE relationships determine aging and help avoid over-discharge misreports.
- Different chemistries age differently: LFP is durable with flat fade; NMC/NCA offers high energy but worsens with deep cycling; LTO lasts longest but has lower energy.
- Degradation mechanisms include SEI growth, lithium plating, and electrolyte breakdown, influenced by temperature, SoC, and cycling.
- Longevity is measured with standardized tests, resistance growth tracking, and prognostic models to extend life.
Battery Cycle Life: What It Is and Why It Matters
What exactly is battery cycle life, and why does it matter? We define cycle life as the number of full equivalent charge/discharge cycles until capacity hits the end-of-life threshold, typically 80%. Cycle life describes how long a battery retains a certain percentage of its original capacity under defined testing, and real-world results may differ due to temperature, power draws, and irregular use. We calculate full cycles by summing partial DoD usages—two 50% discharges equal one cycle. Standard tests fix DoD, C-rate, and temperature, reporting cycles to a target capacity, not a sudden failure. Calendar aging also degrades capacity, but cycle life isolates the mechanical and chemical wear tied to cycling. Cycle fatigue emerges as capacity fades and resistance rises, driven by thermal stress, degradation kinetics, and material constraints. Reliability tradeoffs surface when higher robustness costs energy density or price. Pricing dynamics reflect chemistry choices, cycle life targets, and thermal management costs, shaping total cost of ownership for different applications.
Key Terms You’ll See: DoD, FCE, SoC, and End-Of-Life

Where do DoD, SoC, FCE, and End-Of-Life fit into battery life? We explain these terms by linking capacity, remaining energy, and the cadence of use. DoD shows how much energy we remove from a full charge; SoC is the real‑time fraction of FCC remaining; FCE (FCC) is the current maximum energy the cell can hold and declines with aging; End‑Of‑Life marks when capacity falls to industry thresholds. The interdependency shapes degradation risk and planning, with dod definitions and fce constraints guiding forecasts and protection strategies. Accurate DoD/SoC tracking reduces over‑discharge events and misreported states, improving longevity.
DoD, SoC, and FCE together shape aging, risk, and protection strategies for battery life.
- Key definitions and relationships
- SoC versus DoD in practice
- FCC decline and its impact
- End‑Of‑Life thresholds
- Measurement challenges and accuracy
Aging by Chemistry: LiFePO4, NMC/NCA, and LTO Compared
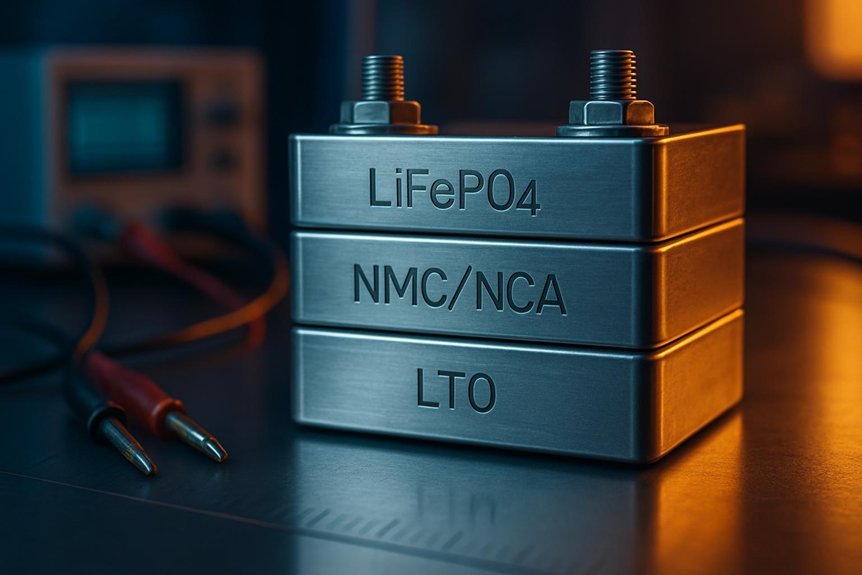
From the prior subtopic, we know DoD, SoC, and FCC interplay with aging; here we compare how chemistry governs wear across LiFePO4, NMC/NCA, and LTO. We analyze distinct aging drivers: LFP offers flat capacity fade, wide safe windows, and strong cycle endurance, with limited degradation when 100% SoC or high temperatures are avoided. NMC/NCA deliver higher energy density but suffer lattice changes and loss of active material under deep cycling and high voltage, reducing cycle life unless DOD and voltage are constrained. LTO provides exceptional cycle life and ultra‑high rate capability, at the cost of low energy density. Across chemistries, cathode stability, anode SEI dynamics, and temperature effects shape overall chemistry tradeoffs and cycle endurance. New factual point about temperature resilience The LFP category also tends to maintain performance better under moderate thermal stress, contributing to longer real‑world longevity in variable climates.
The Main Degradation Mechanisms You’ll See
We’ll start by identifying the core degradation pathways that govern how cells age in real operation: mechanical degradation, SEI growth and instability, lithium plating, and electrolyte decomposition with gas evolution. We summarize core mechanisms concisely, linking each to empirical observations like cracking, SEI thickening, plating, and gas-induced impedance. We frame degradation as coupled, temperature- and SoC–dependent processes, where microstructural changes drive performance loss and aging rates. We also note that system-level factors—cell design, activity patterns, and cycling protocols—control how these mechanisms manifest, akin to weather forecasting where small changes presage large outcomes. Attention to operando signals and diagnostics supports practical mitigation, including smarter garbage collection of degraded material fractions and protocol-aware management.
- Core pathways and coupling
- Temperature/SoC effects
- Diagnostic signals
- Protocol-informed management
- System-level design implications
How to Measure, Model, and Extend Battery Longevity
What are the practical levers for measuring, modeling, and extending battery longevity, and how do they interact across data, physics, and operating protocols? We measure cycle life via capacity retention, DoD-normalized EFC, and RUL from fade curves, using standardized test matrices to improve comparability. On-cell sensors, BMS telemetry, and EIS/DCIR track resistance growth and power fade, while post-test diagnostics partition degradation modes. Data-driven features feed prognostic models, yet validation must span capacity, resistance, and mode metrics. Empirical, physics-based, and hybrid models each bring strengths; uncertainty quantification and transferability ensure fleet relevance. Accelerated testing estimates lifetime, but extrapolation hinges on controlling temperature, C-rates, and SoC window. We aim to minimize irreversible reactions and electrolyte depletion through balanced protocols, robust diagnostics, and multidisciplinary collaboration.
Frequently Asked Questions
How Does Calendar Aging Interact With Cycle Aging in Practice?
Calendar aging and cycle aging couple tightly: calendar aging shifts lithium inventory and impedance, preconditioning stress that accelerates cycle coupling, amplifying degradation pathways; during cycling, higher resistance and nonuniform aging feed back to worsen calendar-driven losses.
Can a Battery’s Cycle Life Be Traded off for Energy Density?
Yes, we can trade cycle life for energy density, like balancing a tightrope, but with constraints. We observe high current accelerates degradation, causing rapid aging, so gains in energy density come with measurable, empirically documented losses in cycle life.
What Alpha/Beta Sizing Is Needed for Accurate RUL Predictions?
We need alpha sizing to capture 80–90% of systematic degradation and beta sizing to explain remaining variance, with 30–50 cells minimum; stratify by temperature/duty, and re-estimate periodically for accurate RUL predictions.
How Do Different BMS Strategies Influence Measured Dod and FCE?
We see that BMS strategy shapes measured DoD and FCE dramatically. By adjusting voltage windows, SOC estimation, and balancing, we alter cycle life metrics, DoD accuracy, and FCE throughput, yielding higher or lower durability estimates.
Do Lab Results Reflect Real-World Cycling Under Varied Temperatures?
We’ll be honest: lab test realism isn’t perfect; temperature variance impact and dynamic profiles rarely mirror real-world cycling. We authors observe—yes, lab results often diverge from field performance, despite controlled conditions and repeated trials.
Conclusion
We’ve mapped the cycle-life landscape with laser precision, and the takeaway hits hard: batteries aren’t endless power sponges—they’re finite, fragile systems whose health hinges on chemistry, temperature, and how we push them. Ignore aging at your peril; every extra DoD or high C-rate compounds wear. But with careful diagnostics, predictive models, and disciplined use, we can extend life dramatically—like squeezing more miles from every charge—without pretending the cliff isn’t there. Knowledge, discipline, longevity.

