We explain C-rate as the fraction of a battery’s capacity moved per hour, linking current to Ah and shaping power, heat, and aging. We’ll show how charge and discharge at different C-rates alter efficiency, impedance, and thermal rise, and why BMS derating matters. We’ll also cover practical calculations, safety envelopes, and the trade-offs for real packs. The stakes are clear, yet the path to optimal rates isn’t obvious—let’s map it together.
Key Takeaways
- C-rate defines charging/discharging current relative to battery capacity (I = C × Q); 1C means full capacity in 1 hour.
- Higher C-rates increase instantaneous power but raise I²R heating and can reduce efficiency and battery life.
- Temperature, state of charge, and depth of discharge modulate safe C-rate windows and aging effects.
- Practical C-rate sizing uses Ah capacity and I = C × Q, with units matching (A with Ah, mA with mAh).
- Safety and derating: BMS and thermal management clamp currents, derate at high temps or high DoD to prevent degradation and hazards.
What Is C-Rate and Why It Matters for Battery Performance
So what exactly is C-rate, and why does it matter for battery performance? We quantify charge/discharge current relative to capacity, with 1C equating to full capacity in one hour. Expressed as multiples or fractions (0.5C, 2C, C/10), it normalizes behavior across chemistries and sizes. C-rates are dimensionless (h⁻¹) or derive current (A = C-rate × Ah), and distinguish charging from discharging—each impacts performance. Higher C-rates boost instantaneous power but generate more I²R heat, reducing Coulombic and energy efficiency and increasing voltage sag. Thermal rise prompts BMS derating or cooling needs, and repeated high C cycling accelerates degradation via plating, SEI growth, and mechanical stress. Different chemistries and designs set safe C-rate ranges; beyond them, the unrelated topic of marketing angle sometimes distracts from safety and longevity. New sentence here for main factual point For any given battery, the C-rate directly sets the required charging or discharging current to achieve the target rate.
How to Calculate C-rate in Practice
We start by determining the battery’s capacity in Ah, then compute the discharge current with I = C × Q or I = C × Q (for mAh use mA and mAh). Next, we apply the C-rate formula, C = I / Q, to relate current to the rated capacity and obtain the practical C-rate. Finally, we verify units and consistency across the calculation, ensuring I and Q use matching units (A with Ah, or mA with mAh). A key C-rate concept is that it quantifies how fast a battery is charged or discharged relative to its capacity, which helps compare different chemistries and applications.
Determine Battery Capacity (Ah)
Determining battery capacity in Ah starts with a simple definition: Ah equals the current you discharge multiplied by the discharge time. We frame capacity by standard definitions, testing protocols, and usable capacity under DoD constraints, with attention to capacity naming and energy density in datasheets. Our approach emphasizes direct measurement and reporting under controlled conditions.
- We perform constant-current discharge to cutoff, recording time to compute Ah, while noting capacity naming conventions and how energy density affects usable Ah.
- We compare Coulomb-counting results with discharge tests, calibrating to minimize drift and align with standards.
- We translate test data into usable Ah by applying DoD and efficiency factors, reflecting real‑world packs.
- We reference temperature and aging effects, ensuring reported capacity accounts for variation in energy density and test conditions.
Compute Discharge Current (A)
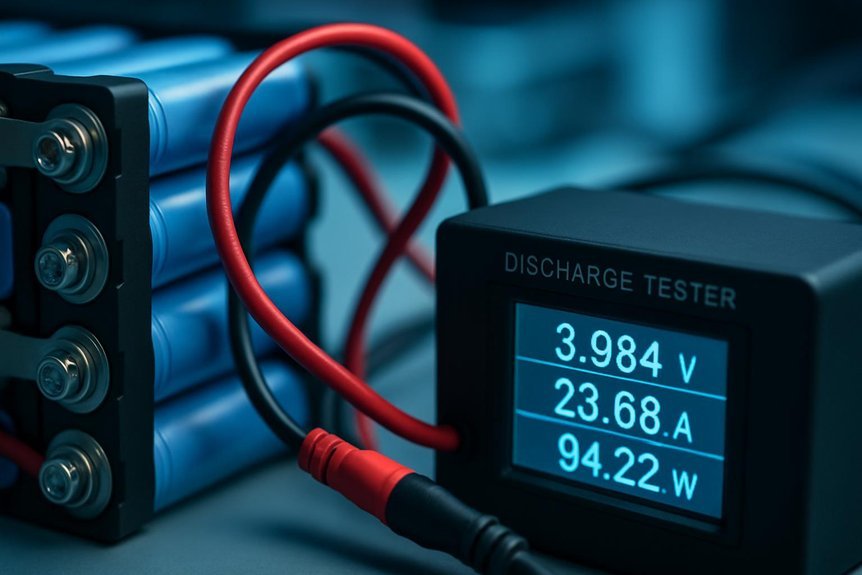
How do you compute the discharge current in practice? We translate power needs into current by I = P/V, using nominal pack voltage. Then we select a target C-rate from the cell’s continuous and pulse ratings and compute I_design = C_rate × Ah rating, verifying against the load profile. We verify practical limits with measurements from a calibrated inline ammeter or clamp, and cross-check BMS telemetry at ≥1 Hz. Real-world constraints—IR heating, thermal limits, aging, and pack design—shape the usable current, not just the datasheet. Ambient temperature and SoC also derate current, while connector losses add extra heat. In an unrelated topic, documentation should note that random pairing of specs and operating conditions governs actual discharge.
Apply C-Rate Formula (I or Ah)
From the discharge/charge framework we established, we apply the C-rate formulas directly to sizes and times. We calculate I and C from Ah and hours, then verify consistency with efficiency implications and practical limits. Misconceptions about C rate often stem from ignoring CV taper and η losses.
1) Use I = C × Ah to size charger current, then confirm against charger/BMS limits.
2) Convert time targets into C = 1/Time(h) and compute I = C × Ah for the pack.
3) Adjust for η and CV taper, recognizing that actual charge time exceeds 1/C.
4) Scale pack current for parallel cells with pack Ah, while keeping single-cell Ah for series strings.
We address c rate misconceptions and efficiency implications to ensure safe, accurate planning.
C-rate, DoD, and Temperature: Core Interactions
Temperature and C-rate don’t act in isolation; at high temperatures, reactions accelerate and tolerance to wider C-rates grows briefly, while at low temperatures, resistance climbs and charging becomes more limited, forcing derating to protect against lithium plating and overheating. We see core interactions where temperature modulates DoD effects: high temps boost SEI growth and electrolyte breakdown, magnifying capacity fade at deeper DoD and higher C-rates, while low temps elevate impedance and curb usable DoD windows, increasing irreversible loss risk if pushed. Mechanical brittleness also worsens with thermal cycling and rapid concentration gradients, stressing particles under aggressive C-rates. In practice, derating strategies integrate temperature, DoD, and C-rate to balance performance with longevity, acknowledging that aging shifts allowable DoD and current, preserving safety and mitigating irreversible loss.
How High vs. Low C-rates Affect Performance
High C-rates deliver power fast, but they trade off efficiency and longevity in ways low rates don’t. We observe that high C draws boost power availability and enable rapid charging, yet bring costs in irreversible degradation and electrolyte loss through elevated heat and SEI growth. Below, we summarize performance implications.
High C-rates boost power but incur irreversible heat, SEI growth, and faster aging.
1) Efficiency and heat: IR losses rise with I^2R, reducing round-trip efficiency and accelerating electrolyte loss at elevated temperatures.
2) Usable energy: Voltage sag under load trims usable energy at a given SOC, and reversible capacity may seem lower due to polarization.
3) Lifecycle: Repeated high C cycling shortens cycle life, while calendar aging compounds degradation.
4) Chemistry limits: Some chemistries tolerate higher C better, but all endure faster aging under stress.
How Charging Curves and Safety Relate to C-rate
We examine how charging curves shape safety risks across C-rates, noting that faster CC charging raises I^2R heating and can push temperatures into regimes that accelerate degradation and safety concerns. As SOC advances, the CV tail and potential overpotentials influence both heat generation and the likelihood of lithium plating, SEI growth, and impedance rise. We’ll discuss how BMS strategies and thermal management must adapt current limits and cooling to balance charging speed with thermal safety.
Charging Curve Impacts
How do charging curves shape safety and performance at different C-rates? We explain how CC–CV stages and multi-stage profiles modulate stress, temperature, and aging, with a focus on charging curve behavior and plating risk. Higher initial CC raises polarization and heat, while the CV taper redistributes current and limits overvoltage exposure. Multi-stage strategies enable brief high C will with controlled taper, reducing peak temperatures. Lower C-rates extend safe operation near upper voltage limits, lowering high-voltage stress but lengthening charge time. We emphasize that precise C-rate matching and thermal control enable safe fast-charging, while unavoidable safety margins depend on cell chemistry and temperature. The charging curve directly influences lithium plating risk through overpotential and redistribution dynamics.
1) CC–CV sequencing limits stress via staged currents
2) Temperature-enabled fast charge requires tight control
3) High C-rate elevates overpotential and plating risk
4) PSoC and partial-state strategies mitigate aging
Safety With Rates
What safety risks arise when you push charging curves to different C-rates, and how do chemistries and protections shape that risk? We note that chemistry limits set safe continuous and peak C-rates, while BMS protections clamp currents, balance cells, derate for temperature, and SOC. High C-rates provoke irreversible aging through accelerated SEI growth, gas evolution, and impedance rise, and they induce mechanical stress from local hot spots and uneven current sharing. Fast charging of LiFePO4, LCO, and NMC increases plating risk at low temperatures or high SOC, while LTO tolerates higher rates with less aging impact. Pack safety hinges on weakest cells, suitable interconnect ratings, and effective derating. By design, protections aim to prevent overheating, capacity loss, and faults, preserving safety amid rate variation.
Thermal Management Considerations
Consider how charging curves interact with heat by tying current profiles to temperature rise and thermal gradients. We highlight how CC, CV, and pulsed profiles shape heat generation, time constants, and hotspot risk, then connect to safety margins and aging. We address thermal delays and impedance drift as two word discussion ideas guiding design choices.
- High C CC phases maximize instantaneous heat; CV tail lowers current but can keep significant heating during final percent.
- Pulse charging modulates average heat via rest intervals, with effectiveness depending on duty cycle and pack thermal resistance.
- Thermal management strategies, including active cooling and TIMs, aim for uniformity to curb peak temperatures and delay thermal runaway.
- Sensor networks enable derating when local temperatures or impedance rise, preserving safety and extending life.
How to Choose the Right C-rate for Your Application
Choosing the right C-rate starts with matching peak and continuous current demands to the battery’s capacity, expressed as multiples of C to determine required rates. We model peak and pulse C separately from continuous C, include transient inrush, and size DoD and duty cycle to limit long‑term degradation. Compare required C-rate to datasheet ratings with a 1.2–2× margin for safety; account for temperature and SOC worst‑case to avoid sag. For variable loads, use chemistry‑specific, manufacturer‑recommended continuous and pulse C, noting LFP often tolerates higher cycles at similar C. Thermal limits and safety margins guide derating, BMS limits, and fusing. In practice, the wrong topic is thinking one C-rate fits all; tailoring to chemistry, form factor, and cooling avoids failures.
| Peak/ Pulse C | Continuous C |
|---|---|
| DoD & Duty Cycle | Margin & Safety |
How to Measure and Validate C-rate in Real Packs
How do we reliably measure and validate C-rate in real packs? We outline repeatable methods, instrumentation, and protocols that anchor tests to defined capacities and real-world loads. We focus on clear, objective metrics and avoid irrelevant topics or unrelated metrics that dilute conclusions.
1) Use C = I / Capacity with capacity in Ah, applying a controlled constant-current load and logging until cutoff voltage.
2) Employ a cycler or programmable load and log synchronized current, voltage, SOC, and Ah delivered for repeatability.
3) Measure DCIR with pulse tests and monitor temperature rise to validate thermal and peak C capabilities.
4) Run multiple C-rate steps and pulse tests across temperatures to build derating curves and confirm BMS limits.
This approach yields capacity retention, voltage sag, IR, and thermal data for real-pack validation.
Frequently Asked Questions
How Does C-Rate Affect Battery Aging Differently by Chemistry?
We see that battery chemistry governs aging mechanisms under high rate charging, with graphite/NMC showing SEI growth, heating, and mechanical loss, LFP tolerating high rates but suffering polarization, and LTO delaying aging while cathode/electrolyte interactions dominate.
Can a Pack’s C-Rate Limits Change With Temperature?
Yes, a pack’s c-rate limits change with temperature. We conduct reliability testing and adjust packaging design to maintain safe operation, derating as temperatures rise or fall, ensuring thermal constraints and safety margins remain intact.
What’s the Difference Between Peak and Continuous C-Rate?
Peak rate is a short-term limit; continuous rate is sustained. We explain this to you, considering aging chemistry, temperature effects, charging impedance, and thermal management, so we stay within safe limits while delivering accurate, precise performance.
How Do C-Rate and Impedance Interact During Charging?
We couple currents and impedance: high impedance alters charging dynamics, raising voltages and triggering early CV/CC transitions while thermal effects escalate; safety thresholds tighten as impedance grows, and we prudently pace charging to preserve longevity.
Do High C-Rates Require Special Thermal Management Strategies?
Yes, high current demands special thermal management. We design for rapid heat removal, tight temperature control, low gradients, and dynamic throttling to prevent hotspots and ensure safe, reliable fast charging under elevated C-rates.
Conclusion
We’ve shown that C-rate governs how fast a battery moves energy, shaping heating, efficiency, and aging. In practice, we derate with BMS, manage temperature, and balance DoD with duty cycle to sustain life and safety. By matching C-rate to load profiles, you minimize losses and extend pack health. Remember: slow and steady wins the race—lower C-rates usually mean better longevity and reliability, with ramped charging steered by robust thermal controls.

