We’re discussing RV lithium battery bank sizing, and it’s a coincidence how often practical setups outpace generic advice. We’ll frame it rigorously: quantify Ah, Wh, DoD, and C-rate, verify against manufacturer data, and line up with duty cycles to set inverter sizing, losses, and thermal limits. We’ll anchor calculations to real-world profiles—from weekend trips to full-time living. If our methods align with standards and show clear headroom, you’ll see why the next step matters.
Key Takeaways
- Define an RV lithium bank by nominal voltage, usable Ah, C-rate, and cycle life, verified against manufacturer data and standards.
- Size for autonomy: estimate daily energy use with a 1.3–1.5 autonomy margin and active/idle duty cycles.
- Account for losses: include inverter and charging losses, PV/controller efficiency, and derating for temperature and age.
- Ensure surge headroom and appropriate DoD: spare capacity 15–25%, min SOC 10–20% to protect lithium chemistry.
- Align design with safety standards and real-world use: tailor packs, BMS, and charging strategies to weekend vs. full-time RV scenarios.
What Is an RV Lithium Battery Bank and Why Size It
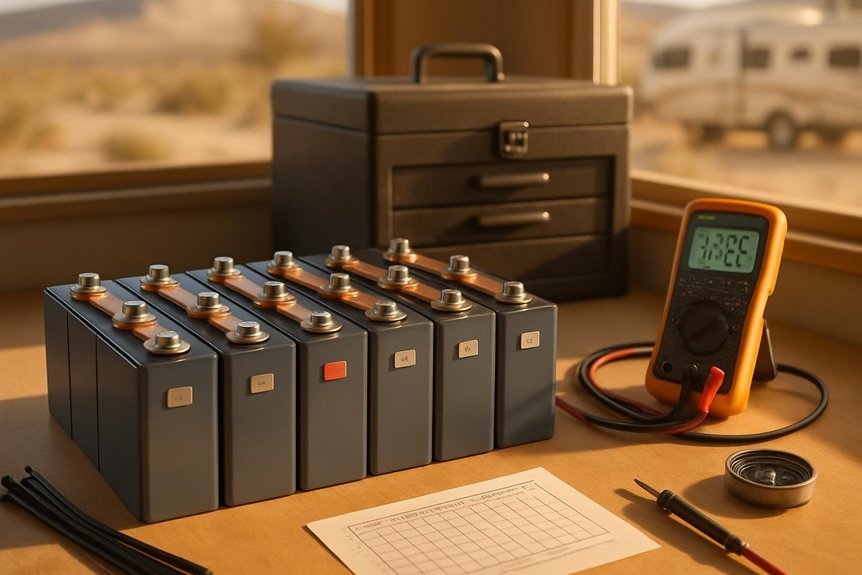
An RV lithium battery bank is a configured array of lithium cells that supplies the house loads and critical systems in a recreational vehicle, separate from the starter battery. We define it by nominal voltage, usable amp-hours, C-rate, and cycle life, then verify with manufacturer data sheets and standards tests. Our approach emphasizes RV lithium, battery logistics, and documented performance: state of charge windows, depth of discharge limits, and thermal management. We quantify capacity in amp-hours at 12V or 24V equivalents, estimate runtime for essential loads, and apply rated inverter efficiency to energy. We require proper cell balance, BMS protections, and fuse sizing per NFPA and IEC guidelines. In sizing decisions, we align with load profiles, charging sources, and service intervals, avoiding oversized or undersized configurations.
Why Sizing Matters: How Much Energy Do You Actually Use?
So how much energy do we actually use in an RV, and why does sizing matter? We justify sizing by measuring peak and average loads, then applying conservative margins to accommodate lithium chemistry and safety margins. Our goal is to ensure continuous operation across typical travel days and varying sun conditions, without oversized ballast or wasted capacity.
1) Daily energy use is a function of load profile, not just total appliances.
2) Peak draw must be supported with short-term headroom to prevent voltage sag.
3) Efficiency and depth of discharge goals drive battery bank sizing, charging cadence, and inverter specs for an RV battery system.
Estimate Your Daily Energy Use in Ah and Wh
How much energy do we actually need each day, and how do we convert that into Ah and Wh without guesswork? We start with measured loads, not impressions. List each device, its rated power in watts, and expected runtime in hours. Sum total daily energy in watt-hours (Wh) by multiplying each device’s watts by hours of use and then add them up. Convert to amp-hours (Ah) at the system voltage (for example, 12 V or 24 V) by dividing the total Wh by the nominal voltage: Ah = Wh / V. Use duty cycle to reflect real usage versus continuous rating: segment the day into active, idle, and standby periods, then compute a weighted Wh. This energy accounting yields precise sizing benchmarks for your RV lithium bank.
Account for Inverter and Solar Losses (Efficiencies You Must Factor)
We must account for inverter efficiency losses and solar charge losses in our sizing calculations, using published efficiency ranges and worst-case deratings. We’ll apply quantitative factors for AC-DC conversions and panel charging, converting all loads to system DC and adjusting for expected efficiencies. By standardizing these loss factors, we guarantee the battery bank and solar array are sized to meet daily Ah and Wh targets with appropriate margins.
Inverter Efficiency Losses
Inverter efficiency losses directly reduce the usable output from your solar and battery system, so we quantify them precisely and separate them from source-rated efficiencies. We model losses as a fixed and variable component across load ranges, using manufacturer efficiency curves and our real-world observations to bound results. Our approach ensures consistent sizing margins and predictable runtime under typical loads.
- Account for rated efficiency at the expected load fraction, then add a conservative derating for peak and part-load ranges.
- Include startup inrush, continuous duty, and thermal effects, adjusting for ambient temperatures and enclosure cooling.
- Separate inverter efficiency losses from solar losses to avoid double-counting, documenting both metrics for transparent comparisons.
Solar Charge Losses
Solar charging losses arise from both inverter and photovoltaic efficiency limits, so we quantify them separately from the source solar input to avoid double-counting. We model total solar charge losses as the product of PV array efficiency, charge controller efficiency, and inverter efficiency, applied to available irradiance and panel area. Typical PV module efficiencies range 18–22%, with MPPT controllers at 95–99% and inverters at 90–98% depending on load and temperature. We translate this into usable amp-hours by applying these factors to daily solar input, then subtracting from the nominal capacity to determine feasible charge cycles. This approach counters solar myths that oversimplify gains. We also account for temperature derating and shaded periods, ensuring conservative sizing for reliable operation across charge cycles and depths of discharge.
Choose a Suitable DoD and Battery Chemistry
We’ll start by quantifying how DoD reductions extend cycle life, comparing typical lithium chemistries (NMC, LFP) under defined C-rates and temperature ranges. We’ll map use-case scenarios to recommended DoD windows, balancing depth of discharge, available energy, and cycle life targets to meet a 5–10 year RV uptime. By outlining chemistry trade-offs—energy density, safety, cost, and recharge performance—we tailer a DoD/chemistry choice to your specific travel patterns and battery budget.
DoD Impact For Longevity
DoD, or depth of discharge, materially influences cycle life and overall longevity of a RV battery bank. We quantify effects to guide selection of battery chemistry and DoD targets that minimize the lifespan impact. Our approach uses predictable, standards-based metrics and conservative assumptions to set practical limits.
1) DoD versus cycle life: higher DoD reduces available cycles; tradeoffs depend on chemistry and C-rate.
2) Temperature and aging: elevated temps accelerate degradation, shifting lifespan impact assessments.
3) Monitoring accuracy: precise state-of-charge tracking minimizes over-discharge events and preserves capacity.
We recommend aligning DoD with manufacturer or IEC/UL ratings, then validating through controlled cycling data. By combining these factors, we define a robust DoD that preserves performance, life expectancy, and total cost of ownership for the RV battery bank. Battery chemistry guides the feasible DoD window, shaping your expectations for lifespan impact.
Chemistry Trade-Offs Explored
Which DoD and battery chemistry deliver the best compromise between usable capacity and cycle life under RV usage patterns? We argue that a 80% DoD with NMC or LiFePO4 chemistries offers robust standby power and predictable cycle life. NMC provides higher energy density, improving usable capacity, while LiFePO4 shines in safety, thermal stability, and longer calendar life at modest temperatures. For standby power and infrequent cycling, LiFePO4’s flat discharge curve reduces voltage sag, preserving usable energy across arrays. We quantify: NMC at 80% DoD yields ~1800–2500 cycles; LiFePO4 yields ~4000–7000 cycles under similar temps. Charging cadence profiles influence efficiency more than chemistry alone, with slower C-rates enhancing cycle life.
| Chemistry | Pros/Cons |
|---|---|
| NMC | Higher energy density, faster charging |
| LiFePO4 | Safer, longer life, lower energy density |
Use-Case Tailored Selection
What Do RV users gain by tailoring DoD and chemistry to a given duty cycle? We gain predictable performance, longer lineage of cycle life, and aligned safety margins, enabling optimized energy planning per application. We quantify impact with DoD, C-rate, and temperature constraints, then select chemistries that meet standards and vendor data. Two word discussion idea 1, two word discussion idea 2, appear as design anchors to ensure cross-checkable decisions.
- Duty-cycle mapping: align DoD with expected depth, avoiding unnecessary aging.
- Chemistry alignment: match energy density, thermal behavior, and charge acceptance to use-case loads.
- Validation: verify through manufacturer specs, cycle tests, and safety standards before deployment.
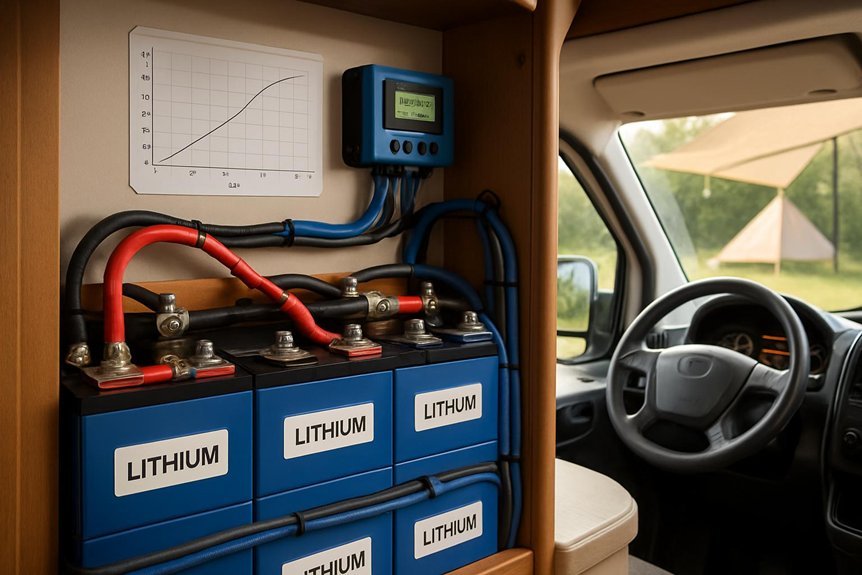
Match Battery Capacity to Your RV Load Profile
How do we size RV battery capacity to your actual load? We approach this by profiling load in watts and amp-hours across typical dwellings, then applying a 1.3–1.5 safety margin for autonomy. We map distinct draw blocks: essential loads (fridge, lights, CPAP), controllable loads (water heater, inverter chargers), and stochastic peaks (microwave, AC when used). Using a 12V nominal system, we convert to amp-hours with derating for temperature and age, then compute required bank capacity in Ah and Wh. We confirm the target runtime and daily energy usage, then select a battery chemistry and format that satisfies both energy throughput and cycle life. Inverter sizing and Battery chemistry discussions anchor the design, ensuring the bank meets autonomy without oversizing.
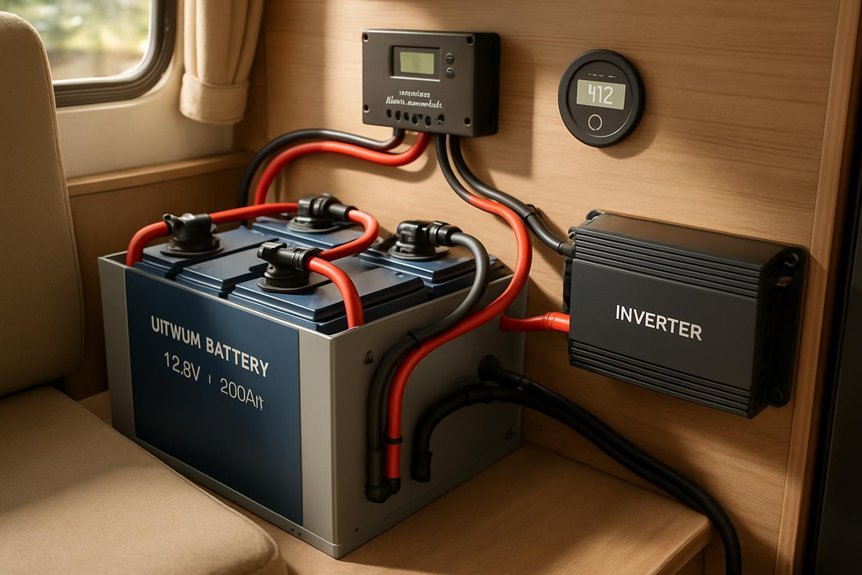
Size Inverter and AC Demand for Real-World Usage
Sizing the inverter and anticipating AC demand must align with the real-world load profile we just built. We present a rigorous, standards-based framework for inverter sizing that translates measured consumption into equipment requirements for real world usage. We quantify peak and continuous loads, derate for efficiency, and specify a margin aligned with typical duty cycles.
1) Determine continuous wattage by summing nonstop loads and multiply by 1.0–1.1 to cover minor fluctuations.
2) Add peak surge capability for onboard devices (compressors, inverters with startup surges) and verify this against the inverter’s surge rating.
3) Select an inverter size that yields a useful capacity fraction (DC-AC efficiency-adjusted) while preserving battery health and runtime targets.
Include a Practical Safety Margin for Spare Capacity
A practical safety margin for spare capacity is essential to sustain reliability under real-world variations in load, temperature, and aging. We quantify margins as a percentage of usable capacity, typically 15–25% beyond estimated peak draw, to meet cell aging curves and inverter tolerance. We require a defined minimum state of charge (SOC) floor, commonly 10–20% for lithium packs, to preserve voltage headroom and prevent deep-discharge risks. Our calculations incorporate worst-case ambient temperatures and load spikes, applying derating factors per standards-based manuals. We document spare capacity as a design parameter, not a warranty cushion, and verify it through cycle testing and thermal monitoring. Emphasizing battery safety, we align margin targets with manufacturer specs and regional electrical codes, ensuring consistent performance without compromising pack longevity or safety margins.
Practical Scenarios: Weekend Warrior vs. Full-Time RV
Are weekend warriors and full-time RV dwellers operating under the same energy constraints, or do their usage profiles demand distinctly different sizing and margin strategies?
We, as practitioners, analyze load profiles, autonomy targets, and seasonal variation to ensure robust margins for both cases. The distinctions drive concrete design decisions:
1) Weekend warrior: lower daily amp-hours, higher peak surges, shorter duty cycles, and greater battery cycling variance.
2) Full time living: consistent daily usage, stricter DoD limits, and tighter temperature-muted efficiency considerations.
3) Shared approach: apply formal reserve margins, thermal management discipline, and standardized health monitoring to maximize bank longevity.
Understanding these differences helps us tailor packs, BMS settings, and charging strategies for Weekend warrior and Full time living scenarios.
Frequently Asked Questions
How Long Will a Fully Charged Bank Last Under Peak Use?
We can’t determine exact duration without specifics, but by standards-based estimates, a fully charged bank lasts hours to days under peak use, depending on lithium battery lifecycle, depth of discharge, inverter efficiency, and loads. We optimize with precise measurements.
Can Lithium Cells Be Recycled at End-Of-Life on the Road?
Yes, we can recycle lithium cells on the road, though legality varies by jurisdiction and facility availability. We’ll quantify recovery efficiency, track on-road disposal compliance, and cite standards like UL 1973, IEC 62133, and RCRA-compliant practices.
Do Temperature Changes Require Battery De-Rating or Sizing Tweaks?
Temperature changes require some derating and sizing tweaks. We follow standards, apply temperature derating factors, and adjust battery monitoring thresholds to maintain safe, reliable performance for our system. We quantify derates and implement proactive monitoring throughout operation.
What Are Common Failure Modes in RV Lithium Banks?
Failure modes commonly include cell imbalance, thermal runaway risk, BMS communication faults, and EMI susceptibility. We’ll quantify MTBF, voltage sag, and charge efficiency, addressing low risk topics and unfamiliar terminology to keep you informed and compliant.
How to Budget for Long-Term Battery Health and Replacement Costs?
We budget for long-term health by defining budgeting horizons, forecasting replacement timing, and tracking battery aging, using cost planning with quantified targets and standards-based methods to minimize risk and optimize lifecycle value.
Conclusion
We’ve sized your RV battery bank with rigorous, standards-aligned calculations, mapping Ah, Wh, DoD, and losses to real-world duty cycles. Think of your system as a carefully tuned instrument: the inverter’s peak demand, solar recharge, and thermal margins harmonize within conservative headroom. By framing energy as measurable steps, we avoid rough sketches and embrace precise safety margins. In practice, you gain dependable autonomy, predictable cycles, and a smoother travel rhythm, even when sun and peaks don’t cooperate.

