An interesting starting point is that a battery’s safety profile often hinges on how we identify chemistry and labeling before any test begins. We approach this data-driven, methodical, and precise, laying out safety prerequisites, non-destructive checks, and clear criteria for SOC, charging, discharging, and fault logging. We’ll consider thermal baselines, impedance, and protection circuit behavior, then decide whether to continue, recycle, or retire the pack. Let’s proceed with structured steps and documented decisions.
Key Takeaways
- Identify battery chemistry from labels, datasheets, and pack information to choose appropriate safety procedures and testing limits.
- Perform non-destructive checks (OCV, impedance, form factor) and visual/thermal inspections before any testing.
- Determine SOC from rested OCV after stabilization, using chemistry-specific curves and aging corrections.
- Use CC-CV charging and defined discharge protocols to measure capacity, cycle life, and track energy metrics (Wh, Ah, T).
- Verify safety and protection functions (fault responses, over/under-voltage, isolation) and document results for end-of-life decisions.
Identify Battery Chemistry and Safety Prerequisites
Identifying a battery’s chemistry is our first step, because each chemistries’ voltages, safety limits, and handling requirements drive every test protocol. We base our assessment on labeling, datasheets, and pack information to constrain our approach. Visual inspection guides initial categorization, noting form factor and markings, then material sourcing confirms the chemistry when label data is ambiguous. We document nominal voltages (3.6–3.7 V for Li-ion variants, ~3.2–3.3 V for LiFePO4, higher stability for LiCoO2, and balanced chemistries in LiMn2O4/NMC) and typical full-charge values. Non-destructive tests—open-circuit voltage, form factor, and impedance profiles—refine the type without disassembly. We emphasize safety prerequisites per chemistry, ensuring appropriate handling and storage before testing.
Visual and Thermal Safety Checks Before Testing
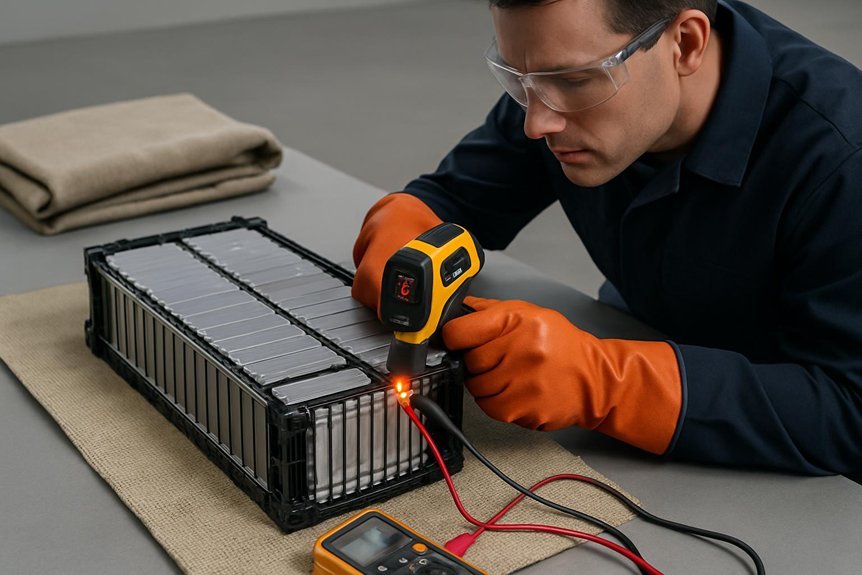
How can we guarantee safety before we test? We approach visual and thermal safety checks with a structured, data-driven mindset, documenting findings to prevent faults from advancing. Our focus is visual inspection and thermal safety, ensuring the pack remains within safe operating parameters before any load is applied.
1) Conduct exterior visual inspection for swelling, punctures, corrosion, leakage, and legible labeling to confirm integrity and authenticity.
2) Inspect pack and module interconnects, BMS enclosure, alignment, fasteners, and insulation for signs of damage or modification.
3) Perform thermal pre-checks: ambient temperature, resting state after transport, and absence of confined, ventilated hazards, with monitoring tools ready.
4) Assess thermal risk indicators in real time, noting hot spots, rapid temperature rise, and audible signs, and disable testing if anomalies persist.
To establish a baseline for voltage status before any testing begins, incorporate a quick open-circuit voltage check as a non-load indicator of charge level and to help correlate subsequent thermal readings with the current state of charge.
Determine SOC From Open-Circuit Voltage (OCV)
We determine SOC from Open-Circuit Voltage (OCV) by capturing the relaxed voltage after a defined current profile, then mapping that voltage to SOC using a chemistry-specific OCV–SOC curve or model. Our approach accounts for chemistry, aging, and cell-to-cell variability, recognizing that OCV–SOC mapping is nonlinear and requires either dense lookup tables or fitted functions. We perform careful rest to reach asymptotic voltage, then apply temperature stabilization and SOH-aware corrections (aging compensation) to align the curve. We present a concise table to illustrate regions, slopes, and expected accuracy.
In practice, the resting protocol must reflect the battery’s chemistry and the current profile history, because OCV reflects the state of charge only after transient effects have settled. OCV relies on achieving a stable open-circuit condition, which is more reliable when the cell has been allowed to equilibrate thermally and chemically after any load. This ensures that the measured voltage corresponds to the true SOC rather than a transient condition.
| Region | Slope/Discrimination | Notes |
|---|---|---|
| Low | Moderate | Begin calibration |
| Mid | Steep | Highest SOC resolution |
| High | Flat | Use aging compensation |
OCV-based SOC accuracy: ±1–5%, depending on region and temperature.
Charge and Discharge to Assess Capacity and Cycle Life
To assess capacity and cycle life, we conduct controlled charge and discharge tests using a CC-CV charger and a programmable load while logging current, voltage, time, and temperature. We follow safety prerequisites, with cell-level protection and environmental controls, and we log data to detect anomalies in lithium chemistry contexts. We perform defined rest periods to improve repeatability and compare cycles. Our approach yields per-cycle metrics like capacity, coulombic efficiency, and energy efficiency, enabling robust cycle-life assessment.
- Use CC-CV charging to a specified cut-off, then CV termination when current decays to the threshold.
- Discharge at chosen C-rates with end voltages per chemistry and manufacturer guidance.
- Repeat for multiple cycles and compute means and deviations.
- Record Wh, Ah, and temperature with each cycle for trend analysis.
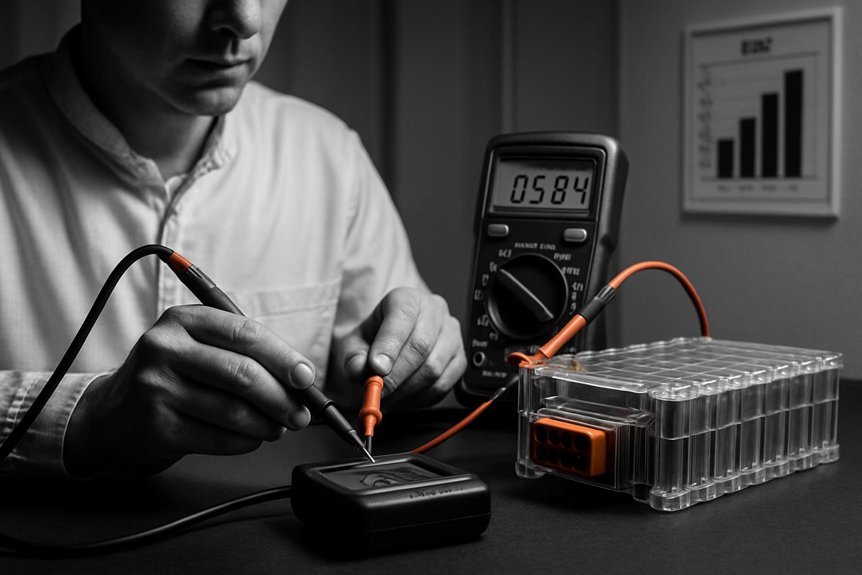
Measure Internal Resistance and Under-Load Performance
We measure internal resistance with pulse, AC, and four-wire methods to separate cell Rint from leads and contact resistance, then analyze how it varies with SOC, temperature, and rest. We report instantaneous DC Rint, AC real impedance at 1 kHz, and, when available, Rohmic components from EIS to decompose diffusion and charge-transfer effects. We also assess under-load performance by observing voltage sag and recovery under representative discharge currents to link resistance to deliverable power.
Internal Resistance Testing
What methods reliably reveal a cell’s internal resistance under both steady and transient loads, and how should we implement them to minimize error and thermal effects?
We measure IR with disciplined, repeatable techniques and control variables to ensure comparability across tests.
- DC pulse method, 0.5–5 s, short ΔV, I known; use four-wire where possible to reduce fixture error.
- AC impedance or LCR at 1 kHz for quick estimates, noting diffusion components may be missed.
- EIS frequency sweep (mHz–kHz) to separate ohmic, charge-transfer, and diffusion resistances.
- Dedicated analyzers with calibrated temperature control to monitor calibration drift and environmental sensitivity.
Controls: rest OCV 30 min–hours, 20–25 °C, consistent SoC, clean contacts, subtract fixture resistance.
Load-Voltage Behavior Analysis
How does a cell behave under realistic loads, and how can we quantify voltage sag, recovery, and transient response to infer internal resistance and power capability? We measure voltage vs time under defined constant-current discharges (0.1C–2C), capture pre-load OCV, under-load, and post-load relaxation, and compute sag and recovery. Higher C-rates yield larger instantaneous voltage drops; for 1C, sag can exceed 100–300 mV versus 0.1C on small-format cells. We perform pulsed loads (10 s on / 50 s off) to assess transient response, measure voltage ripple, and extract time constants. We log at ≥1 Hz, then compare SoC windows with current × SoC lookup maps to evaluate usable capacity under load and energy throughput per cycle. Temperature and thermal rise are recorded to relate sag to resistance shifts.
Test Protection Circuits and Safe Charging Behavior
We’ll start by verifying protection circuit functions and thresholds with controlled tests that record trip and release events, thresholds, and latch behavior. We’ll then assess safe charging profiles by applying calibrated voltage ramps and currents, observing adherence to overcharge, overcurrent, and temperature limits. Finally, we’ll monitor fault responses—trip times, disconnect paths, and recovery—under varied temperature and load conditions to establish repeatable safety margins.
Verify Protection Circuit Function
To verify protection circuit function, we’ll methodically induce controlled fault conditions and observe the responses of the protection IC, MOSFETs, and sense circuitry. We follow data-driven tests that map thresholds, trip times, and release criteria, using precise instrumentation and documentation.
- Open-circuit overcharge: apply voltage above ~4.25V to trigger MOSFET cutoff and confirm release near ~4.08V.
- Over-discharge simulate: drive current or load to reach 2.5–3.0V detect and verify automatic re-enabling after safe recharge.
- Over-current event: source several times nominal current to test fast vs. time-delayed trips and MOSFET endurance.
- Charge-path isolation check: attempt reverse current with charge FET off to validate isolation.
This process avoids unrelated topic detours and random exploration, keeping measurements strict and repeatable.
Test Safe Charging Profile
Carefully characterize safe charging profiles by validating protection circuits and charging behavior under varied CC/CV schemes. We quantify CC magnitudes (0.2C–1C) and CV cutoffs (≈4.20V per cell), then map voltage and current vs. time to locate plateaus and end-of-charge taper (CV current ~0.05C). We test elevated-voltage variants (4.10V, 4.20V, 4.35V) to trade capacity gain against accelerated degradation. We assess charge-rate effects (0.2C, 0.5C, 1C, 2C+) for capacity recovery, IR rise, and temperature. We log coulombic efficiency per cycle and correlate with parasitic losses. Temperature profiling captures delta-T vs. SOC; safety thresholds identify exotherm onset and thermal cutback behavior. For BMS, we verify SOC alignment and prompt charging interruption within 100–500 ms.
Monitor Fault Responses
Building on the safe charging profiles characterized earlier, we now verify how the protection circuitry and charging logic respond under fault conditions. We approach fault responses with a data-driven, stepwise method to confirm thresholds, timings, and safe-state transitions, including the risks of thermal runaway and moisture ingress.
- Validate over-voltage, under-voltage, and short-circuit responses by timing trips and recording state changes, ensuring fast (<100 ms) and clear disconnects.
- Inject sensor faults and confirm fault flags, safe-state hold, and whether bypass or full-system disconnect activates as designed.
- Assess temperature monitoring and derating decisions across voltage and current ramps, checking hysteresis and cutoffs outside safe ranges.
- Test protective hardware, including FETs, fuses, and PTCs, under thermal and vibration stress to ensure robust isolation and restart behavior.
Document Results and Decide on End-of-Life or Continued Use
How do we translate test results into a clear decision on end-of-life versus continued use? We apply predefined criteria: cutoffs by chemistry, minimum usable capacity (≤70–80%), and IR thresholds (DCIR ≥2× baseline, or ≥3× for retirement). We record OCV at standard state, temperature, and time since last charge; measure capacity per controlled cycles; log DCIR and AC impedance with method noted; track cycle count, history, and any abuse events; and log thermal behavior during tests. We compute remaining capacity percent, IR ratio, and trend-fit remaining useful cycles, including uncertainty bounds. Our decision matrix flags safety events, capacity ≤70%, or IR ≥3× baseline as fail; else we monitor with defined limits. Documentation includes headers, raw data, methods, justification, retention, and a clear recommended disposition, referencing end of life and capacity fade.
Storage, Disposal, or Recycling Recommendations Based on Findings
From the test results, we translate findings into concrete storage, disposal, or recycling actions that minimize risk and maximize material recovery.
1) Storage safety: keep 30–50% SOC for long-term storage, 15–25°C ambient, and isolate in non-conductive, fire-resistant containers with clear labeling of date, OCV, IR, and issues; schedule 3–6 month re-checks (monthly for high-energy packs) and top-up SOC as needed.
2) Disposal protocols: separate intact from DDR shipments, use HHW or approved recyclers, and follow local transport rules with proper packaging and documentation.
3) Handling damaged cells: treat as high risk, contain leaks in non-reactive containers, wear PPE, and avoid charging or puncturing.
4) Recycling options: select closed-loop recyclers; prefer hydrometallurgical or hybrid methods for higher metal recovery.
Frequently Asked Questions
How to Differentiate Between Li-Ion Chemistries by Signs Alone?
We can differentiate different chemistries by signs to distinguish: observe resting voltage per cell, plateau shapes, max charge voltages, and cooling/heating patterns; LiFePO4 stabilizes near 3.2V, flat plateaus, and cooler temps compared to NMC/LiCoO2.
What Are the Safest Prying and Piercing Restrictions for Packs?
We’re like precise surgeons, so our safest prying and piercing restrictions start with safe handling and never puncturing packs. We limit access, use noninvasive checks, and prevent thermal run by controlled, documented procedures and remote handling.
How to Estimate Remaining Life Without Full Cycling?
We estimate aging indicators and predict capacity by using partial tests (pulse IR, EIS, IC/DV, resting OCV) and data-driven models, then fuse features to forecast remaining life without full cycling, with uncertainty quantified.
Which Tests Are Most Dangerous for Large-Format Packs?
The most dangerous tests for large format packs are thermal runaway and abuse-driven mechanical/ electrical scenarios. Dangerous tests demand strict containment, remote monitoring, and suppression; we prioritize strategies that minimize propagation risk and secondary hazards.
How to Interpret BMS Logs for Fault History?
We interpret logs by tracing fault history in time order, verifying root causes, and correlating event codes with voltages, temps, and SOC. We compare per-cell data, check transient patterns, and quantify repeat triggers to validate faults.
Conclusion
We’ve laid out a data-driven, methodical approach: identify chemistry and safety prerequisites, perform non-destructive checks, establish a thermal baseline, determine SOC via OCV, then charge/discharge to gauge capacity, cycle life, impedance, and fault handling. We’ll validate protection circuits and safe charging behavior, document every result, and use that record to decide end-of-life or continued use. If you worry this takes too long, know that rigorous testing prevents costly failures and unsafe reuse. Our method mitigates risk and informs decisions.

